SenSen’s Live Operations Platform brings data and intelligence to the patrol a city already runs, turning every pass into a continuous study of how its curb is used. We asked Ben Pisch, SenSen’s SVP Curb Strategy and Growth, where the idea came from, what cities notice in their first month, and why the real goal is a curb that needs less enforcement.
1. Where did the idea for the Live Operations Platform come from? Nothing changes on the street when a city switches it on, so what changes in what the city gets back?
It came out of the operator side. I spent about a decade running enforcement for cities before I moved to the vendor side, and in all that time the LPR units were reading every plate they passed, not just the ones in violation. Those compliant reads were discarded. But each one is an observation: a vehicle, a location, a timestamp. Repeated over an eight-hour shift across a whole beat, they add up to a survey of how the street is being used, which is why I describe the patrol as a census that nobody was collecting.
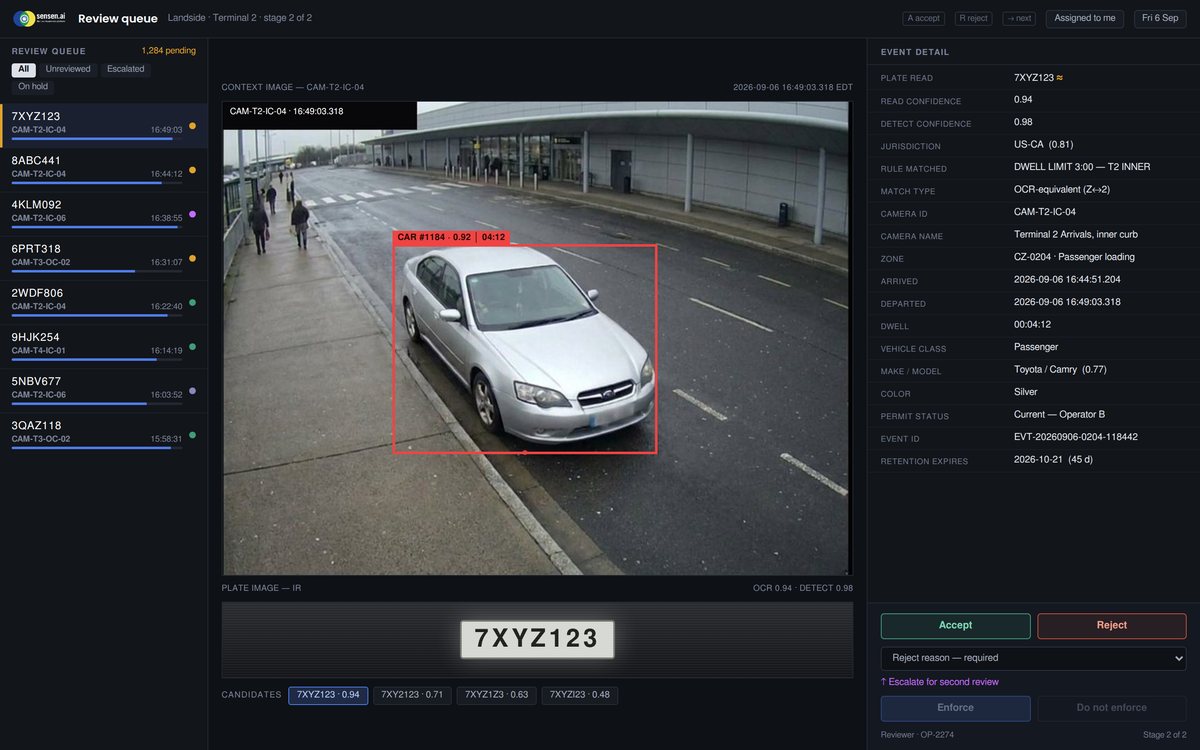
When a city turns the Live Operations Platform on, the field operation is unchanged. Same vehicles, routes, officers and cameras. The difference is what arrives at the end of the shift. Previously that was a citation count. Now it includes occupancy by block face by hour, turnover rates, dwell time distributions, and where compliance is breaking down, all derived from work the city already funds.
2. The Live Operations Platform reads the patrol network a city already runs, rather than asking it to install new sensors at the curb. Why was that the right way to build it?
Mostly economics. A fixed sensor monitors a single stall and carries an ongoing cost: power, connectivity, permitting, pole attachments, and a failure rate that often goes unnoticed for months. A patrol vehicle passes thousands of stalls a day and is already in the operating budget.
There’s also a sampling problem with fixed infrastructure. Cities install where they can afford to, which is usually where they already suspect trouble. The resulting data confirms the assumption and says nothing about the rest of the network. Mobile coverage follows the patrol routes, and those routes can be adjusted when you need answers somewhere new.
The limitation worth stating: this is sampled rather than continuous. Repeat passes produce distributions, not a live feed from every space. For pricing, time limit policy, loading design and staffing decisions, that resolution is sufficient. It also isn’t unproven data. LPR has been in continuous use in North American cities for more than twelve years and stands up in adjudication, so the accuracy question was settled well before anyone applied it to planning.
3. What does a city typically notice in its first month with the Live Operations Platform?
Usually three things. The first is that the inventory is inaccurate. Zone boundaries, stall counts, signage and meter records don’t match conditions on the ground. Our zone and meter reconciliation work in Toronto turned up a meaningful gap, and I haven’t seen a city where the records were clean. Correcting that changes both the revenue and the staffing assumptions.
The second is that demand pressure isn’t distributed the way people assume. A general complaint about downtown parking tends to resolve to a small number of block faces. The Las Vegas study, built from roughly 41,000 scans, showed the load concentrated in a fraction of the study area.
The third is timing. Peak occupancy often falls outside the enforcement shift or the posted meter hours. That’s typically the first correction a city makes, and it requires no additional spend.
4. You have said the goal is a curb that needs less enforcement rather than one that generates more tickets. What does that look like for a council in practice?
It begins with changing the reporting. Citation volume is a symptom measure, and it rises both when conditions deteriorate and when you add officers, so council can’t interpret it on its own. The more useful measures are availability and compliance: whether a loading zone is open when a driver needs it, whether spaces are turning over, whether repeat violations are declining.
From there the work is targeted. Identify the block faces carrying the violations, adjust the regulation on those specific segments, whether that’s a loading window, a revised time limit or a price change, and the violations usually fall without additional enforcement hours.
Then present the before and after. That’s what makes a year of declining citation revenue defensible. You can show what was bought with it, and you stop applying uniform patrol intensity across a network where the problems sit in a small share of the frontage.
5. What will the aggregated curb study add once cities start contributing to it?
A reference point, which the industry currently lacks. Ask what healthy turnover looks like on a downtown retail segment and the answer usually traces back to a single consultant study covering one week, several years ago, under conditions nobody recorded. That’s a thin basis for policy.
A multi-city dataset that refreshes continuously does three things. It tells a city whether what it’s seeing is typical or unusual. It lets cities compare against genuine peers, meaning places with similar usage patterns rather than similar population, which is a different and more useful set. And it establishes a defensible starting position on pricing and time limits instead of defaulting to whatever the nearest large city adopted.
What gets aggregated is usage patterns, not plate data. Plate-level records stay with the city that collected them, and that doesn’t change.