
Better parking management in Australia’s urban centres now depends less on adding more kerb space, which most cities do not have, and more on seeing how the kerb they already own is actually used. As density rises across CBDs and key suburbs, the kerb has become one of the scarcest public assets a council manages, and the traditional tools built to run it (fixed signage, periodic surveys, patrols that record only violations) cannot keep pace with how quickly demand shifts through the day. The answer is a data-led approach: enforcement that is AI-powered and human-led, and that senses occupancy, dwell and turnover on the same passes, so councils can allocate access fairly, verify permits, and make decisions on evidence rather than complaint volume.
This article looks at why rising density is straining parking in Australian urban centres, why the systems most councils inherited struggle to cope, and what a smarter, data-driven approach to parking management looks like in practice. The theme is simple: the kerb is a limited resource under growing pressure, and the councils getting ahead treat it as measured infrastructure rather than a fixed set of rules on a sign.
Why is rising density making parking harder to manage in Australian urban centres?
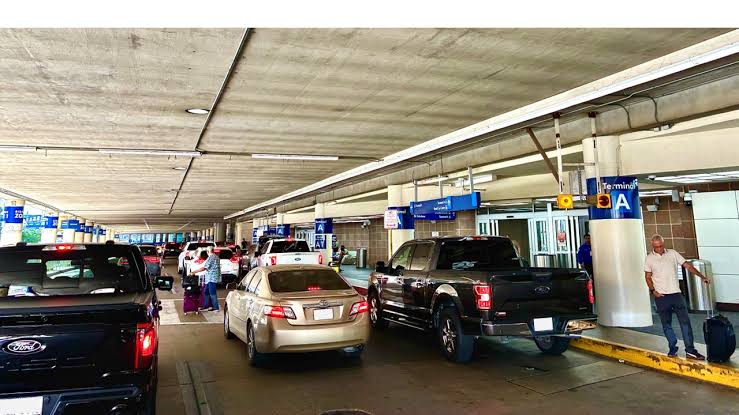
Rising density concentrates more vehicles, deliveries and rideshare movements into the same fixed length of kerb, so demand climbs while supply stays flat. In a growing CBD or a densifying suburban centre, the number of trips competing for a bay rises every year, but the physical kerb does not stretch to match. The result is predictable pressure: peak periods where every bay is taken and drivers circle, and quieter stretches a block away that sit empty because nobody can see where the space actually is.
The harder problem is that density does not just add volume, it adds variability. The same twenty metres of kerb might serve delivery vans at 7am, school drop-off at 8:30, short-stay retail parking through the day, and rideshare pickups in the evening. A static sign and an occasional survey rarely match what the kerb is being asked to do at any given hour. As centres grow, that mismatch widens, and parking management becomes less about issuing tickets and more about understanding a moving picture.
Why can’t traditional parking systems cope with the pressure?
Traditional parking systems cope poorly because they were designed to record events, not to measure the kerb, and they update far too slowly for a resource that changes by the hour. Three things go stale almost immediately.
The rules go stale. A single block face in a busy centre often carries several overlapping regulations, and those rules shift with construction, new bike lanes, resurfacing and seasonal programmes. The sign in the field and the record in the council’s system drift apart, and enforcement, planning and permit checks all inherit the drift.
The picture of usage is missing entirely. Point-in-time occupancy studies sample a handful of days and extrapolate across a year. They miss what actually drives parking policy: how dwell time varies by vehicle type, when demand peaks, and which corridors run heavily overcrowded while the centre-wide average looks healthy. You cannot balance access, price or enforcement attention well on a snapshot of a surface that changes constantly.
And the operational cost is real. When a council relies on complaint volume and manual patrols, effort lands where the phone rings loudest rather than where pressure genuinely sits. Some areas are over-enforced while others go unwatched, utilisation stays uneven, and driver frustration and circling (with the congestion and emissions that come with it) persist because nobody has a live view of where the free space is.
What does data-driven parking management actually mean?
Data-driven parking management means capturing how the kerb is genuinely used, continuously, and applying that single record across enforcement, access, permits and planning, instead of guessing between surveys. The shift is from administering a parking programme to managing the kerb as live infrastructure, the same way a council already manages roads, drainage or lighting.
In practice, one capture feeds several layers at once. The regulatory layer keeps a current record of which rule governs which segment at which time. The activity layer records arrivals, dwell and departures by vehicle type and time of day, which is where occupancy and turnover come from. The permit layer verifies entitlements against what is actually parked. And the planning layer ties it all back to the council’s own choices about time limits, pricing and enforcement cadence. Because the information is collected once and routed everywhere, the same patrol that checks compliance also tells the council how the kerb performed.
Councils such as the City of Adelaide, Brisbane City Council and Wollongong City Council operate exactly the kind of dense, mixed-use centres where this approach earns its place: high competition for kerb space, multiple user groups on the same block, and a real need to allocate access fairly rather than simply react to whoever complains.
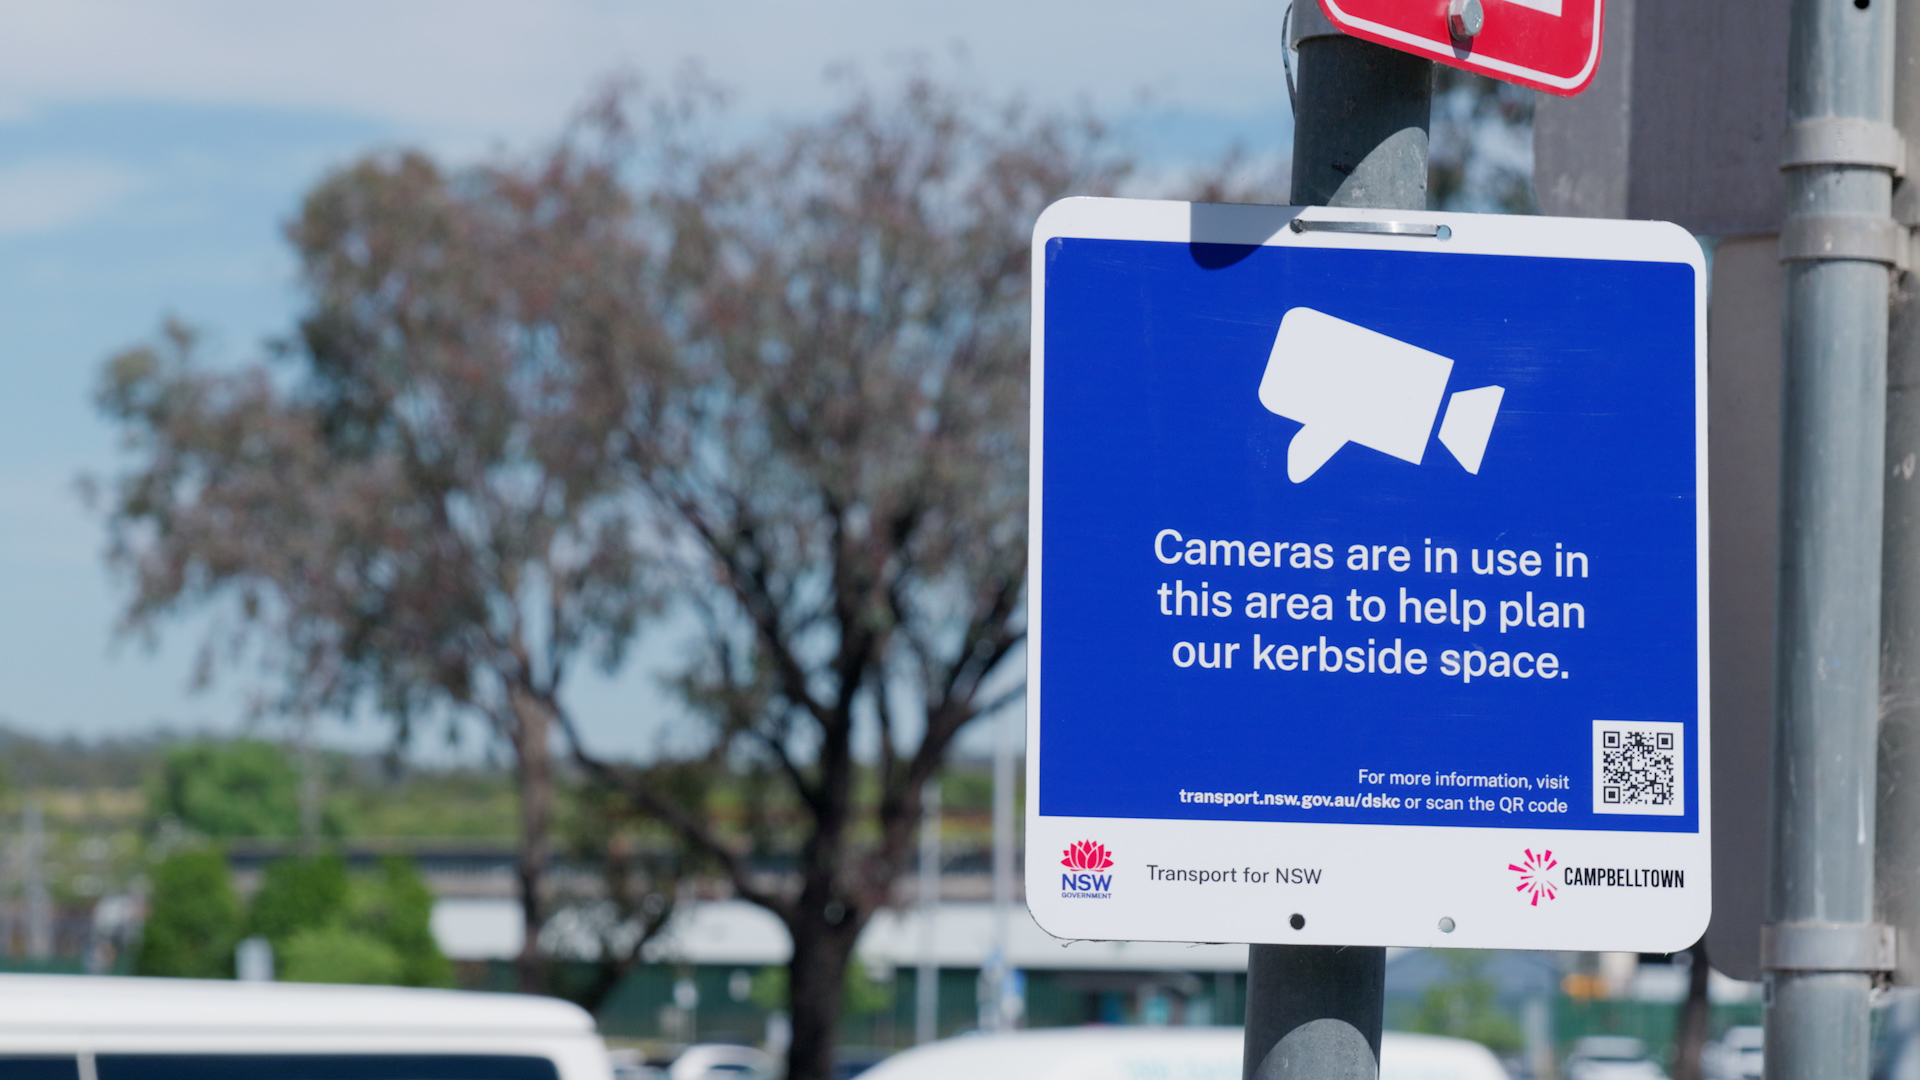
How does AI enforcement also improve parking data and fairness?
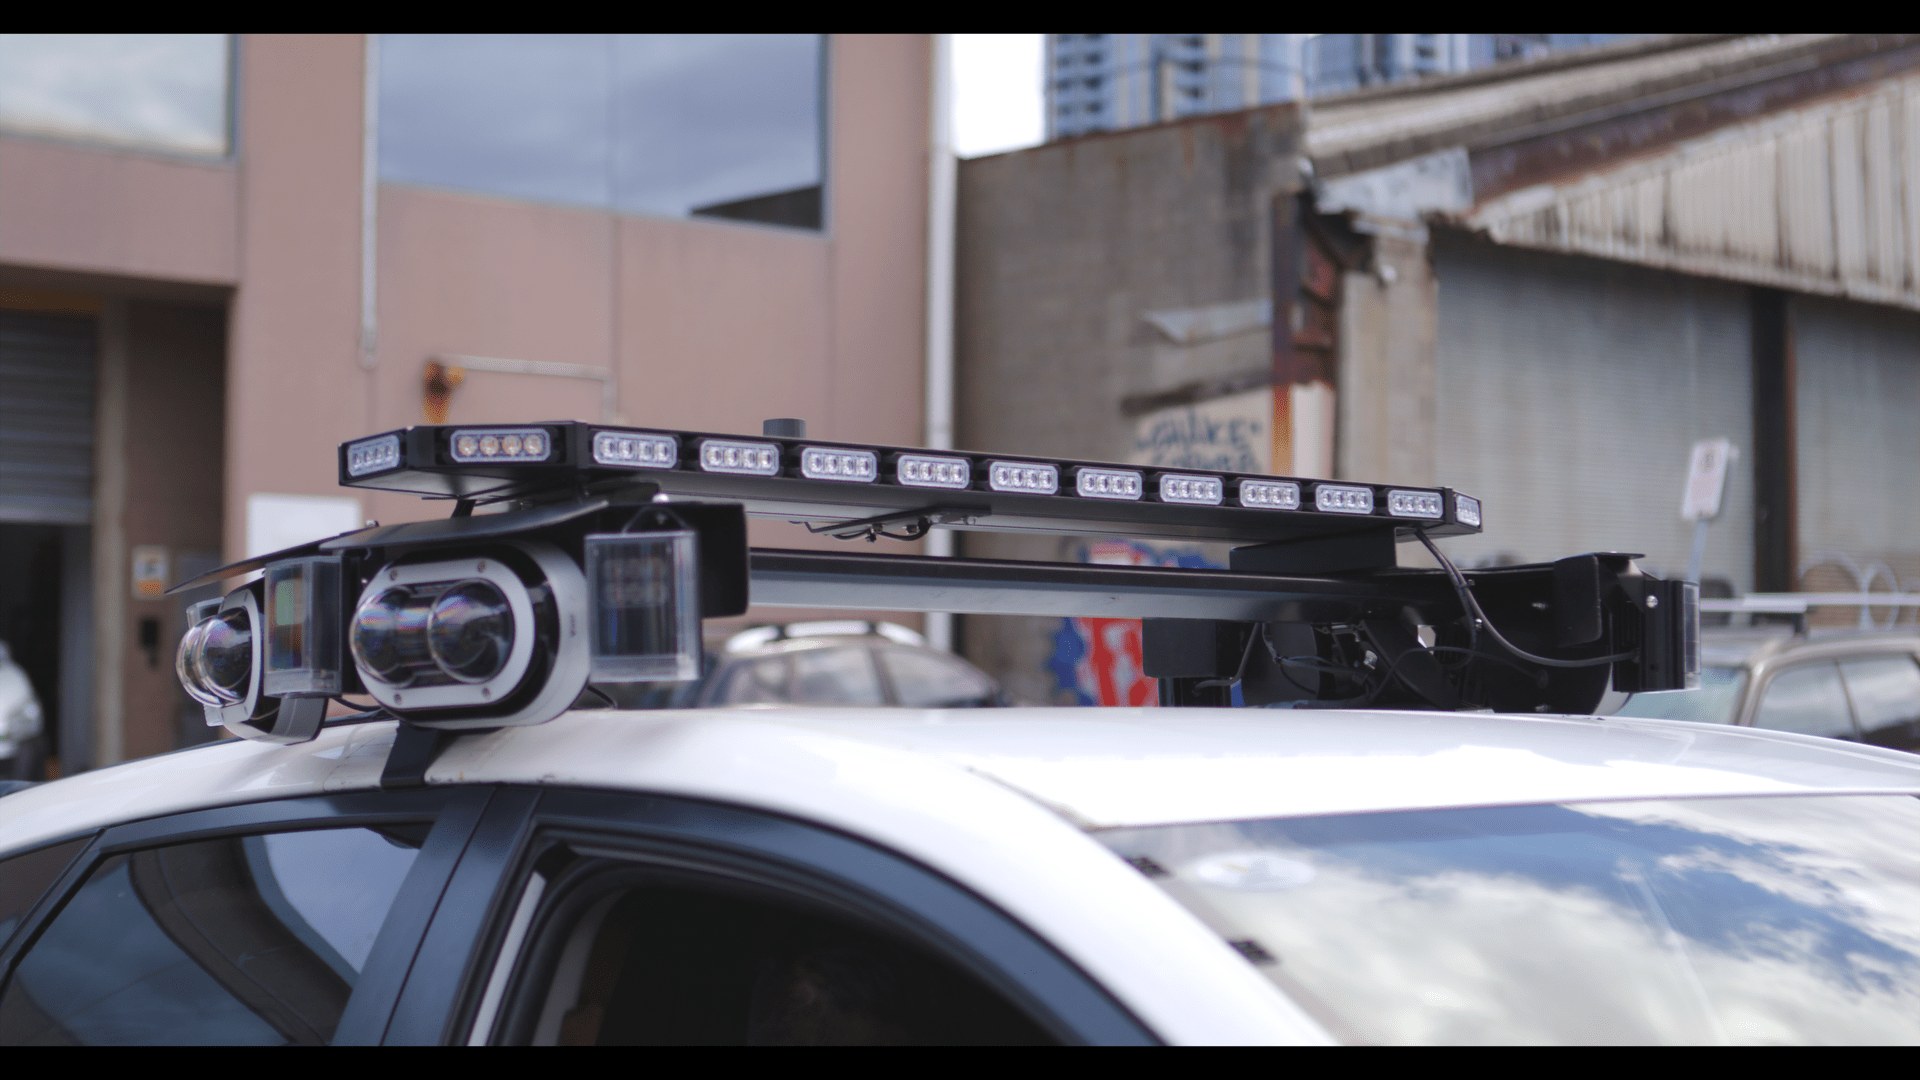
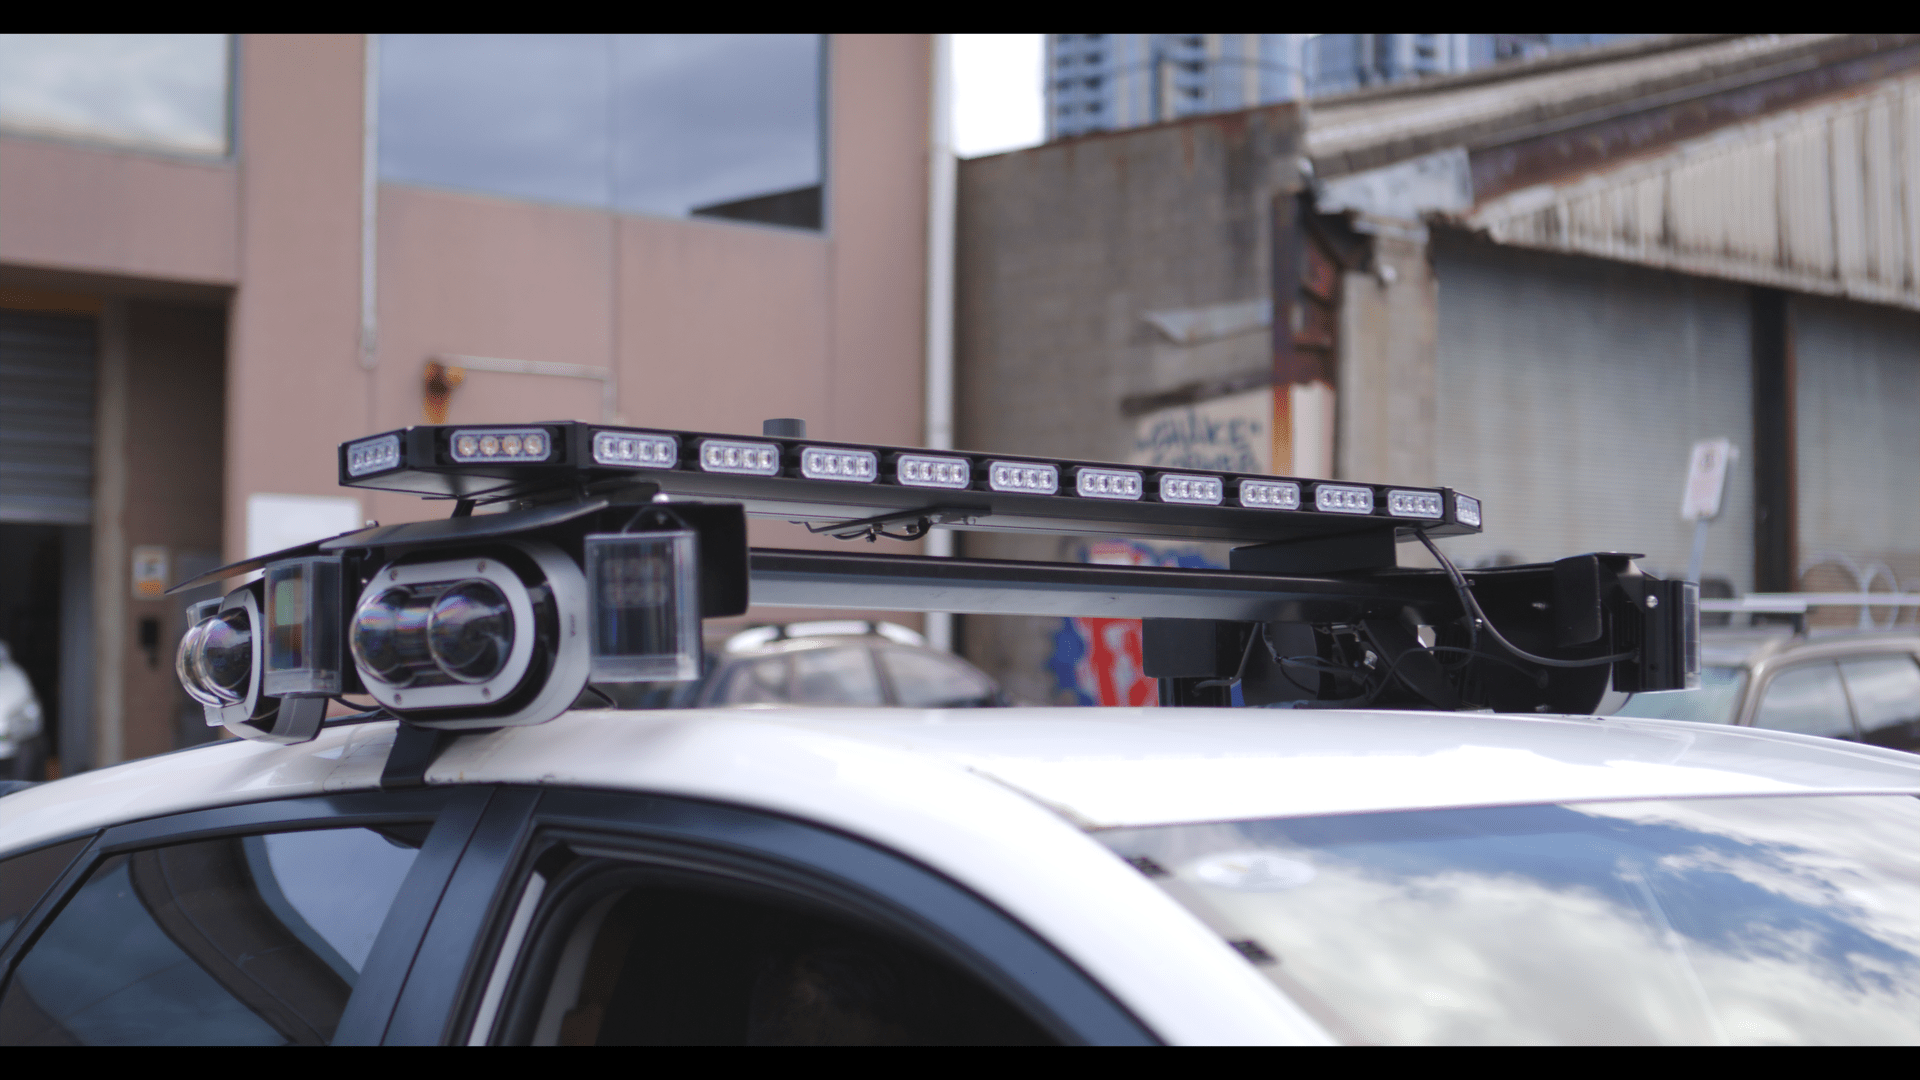
AI enforcement improves the data because it reads the whole kerb, not just the plate, so every patrol pass produces a record of occupancy and turnover alongside any compliance outcome. When an enforcement vehicle drives a beat, it is effectively taking a survey of the entire street each time, which means the council builds a continuous picture of usage as a by-product of work it already does. There is no separate, expensive occupancy study to commission, because the enforcement pass is the study.
Fairness improves for two reasons. First, coverage becomes even. Instead of attention clustering where complaints land, the council can direct patrols and fixed monitoring by where the data shows genuine pressure, so no area is quietly over-enforced and none is left unwatched. Second, every outcome is backed by clear, timestamped, location-anchored evidence, which keeps decisions consistent and reduces disputes.
Just as importantly, the technology is AI-powered and human-led. The system filters edge cases, verifies permits and compiles the evidence, then presents recommendations for an officer to review and approve. Officers spend their time on judgement and community-facing work rather than manual checking, extending coverage across a growing centre without displacing the people who do the job. The kerb is read, and the decision stays with the team.
What can councils do once they can see occupancy and turnover?
Once a council can see occupancy and turnover clearly, it can start balancing access deliberately instead of leaving it to chance. If the data shows one block sitting full while the next runs half-empty, signage, time limits and wayfinding can be adjusted to spread demand, which eases circling and the congestion and emissions that come with it. Short-stay bays can be set where turnover matters most for local retail, and longer-stay allocations pushed to where they cause least friction.
Continuous usage data also lets a council manage permits and loading with far more confidence. Loading zones can be sized and timed to match real delivery patterns rather than assumptions, and permit entitlements verified against what is actually parked, so the right vehicles get priority where it is set aside for them. And when residents or a council meeting question a change, the planning team can answer with measured behaviour on that corridor rather than anecdote, which makes fairer decisions easier to defend.
Where does parking management fit in a wider city intelligence approach?
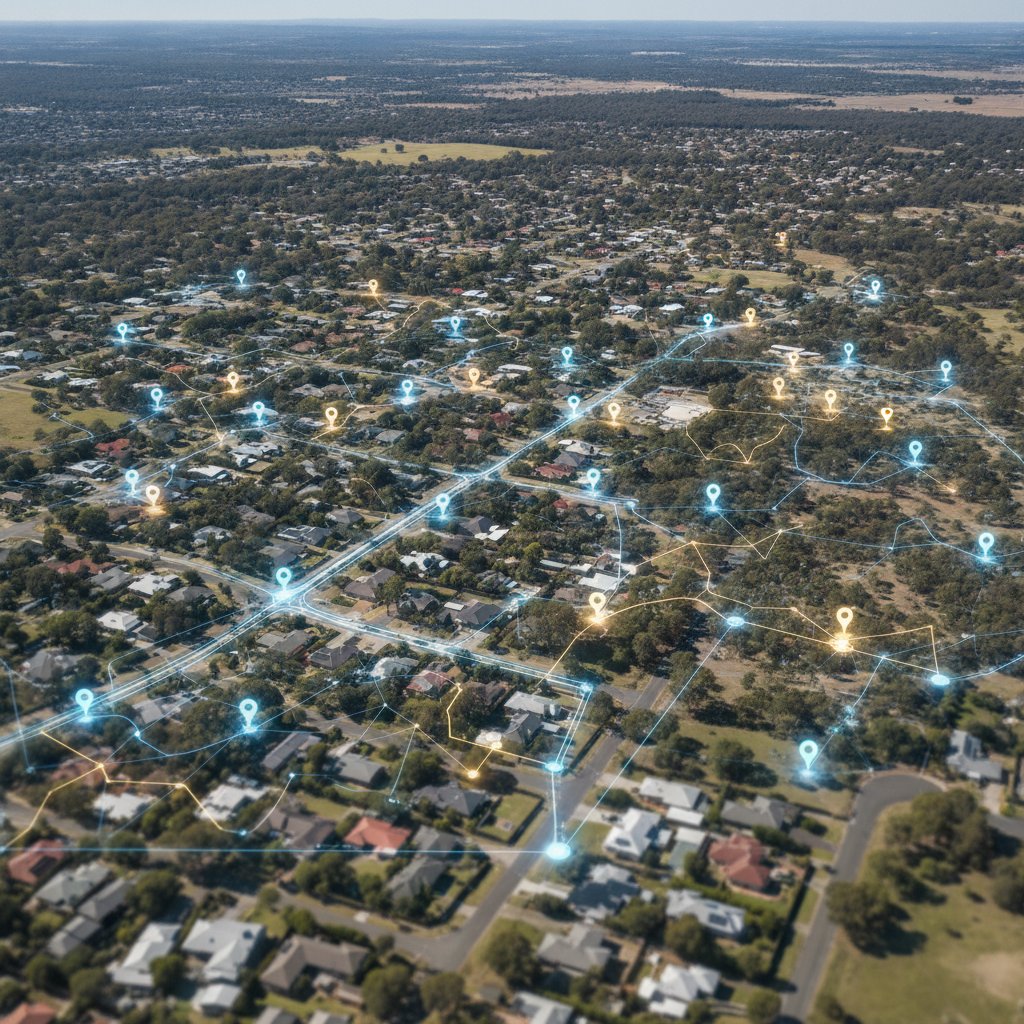
Parking is usually where councils begin, because the bay and the permit already have a budget line, but the same kerb data supports much more. The passes that measure occupancy and turnover also keep an asset record current, and the behaviour they capture informs how a centre is planned as it grows. Treated this way, parking management becomes the first query against a living data layer, with asset condition, access planning and reporting running on the same continuous capture.
That is the real opportunity for a densifying Australian city. Enforcement was where the bay and the ticket already had a budget, so it was the natural place to start measuring. But once a council decides the whole kerb is worth seeing, parking stops being a set of complaints to chase and becomes infrastructure it can plan around with confidence, on a current map rather than a year-old one.
FAQ
What is data-driven parking management?
Data-driven parking management is the practice of capturing how the kerb is genuinely used, continuously, and applying that single record across enforcement, access, permits and planning. Rather than relying on fixed signage and occasional surveys, it treats the kerb as live infrastructure and keeps a current view of the rules, the activity, and the outcomes on every segment, so councils can allocate access fairly and decide on evidence.
Does AI parking enforcement replace parking officers?
No. The technology is AI-powered and human-led. It filters edge cases, verifies permits and compiles evidence, then presents recommendations for an officer to review and approve. Officers still make the call; the system removes the manual work around it, so a growing centre can be covered without displacing the people who do the job.
How does SenSen capture occupancy and turnover data?
From the same passes used for enforcement. SenFORCE reads the whole kerb from an enforcement vehicle during patrol windows, capturing occupancy, dwell and turnover alongside any compliance outcome, while SenPIC provides continuous kerb awareness at chronic-pressure locations from a fixed AI camera. One data backbone, several collection paths, so the kerb stays measured between surveys rather than going dark.
Can a data-driven approach help with uneven parking utilisation?
Yes. Continuous occupancy data shows where the kerb is overcrowded and where it sits empty a block away. With that picture, a council can adjust signage, time limits and wayfinding to spread demand, size loading zones to real patterns, and direct enforcement attention by genuine pressure rather than complaint volume, which reduces circling and evens out access across a centre.
Do councils need to run separate occupancy studies?
Not if the enforcement pass is already capturing the whole kerb. Because SenSen reads occupancy and turnover as a by-product of routine patrols, the survey is built into work the council already does. That removes the need for periodic point-in-time studies and keeps the usage record current, so planning and access decisions are grounded in what the kerb is doing now.
See how AI-powered, human-led enforcement reads the whole kerb in a single pass on our curbside enforcement page, explore the move from paper permits to AI-driven kerbside management, keep your city asset management record current on the same passes, or see how it all connects on the SenSen platform.