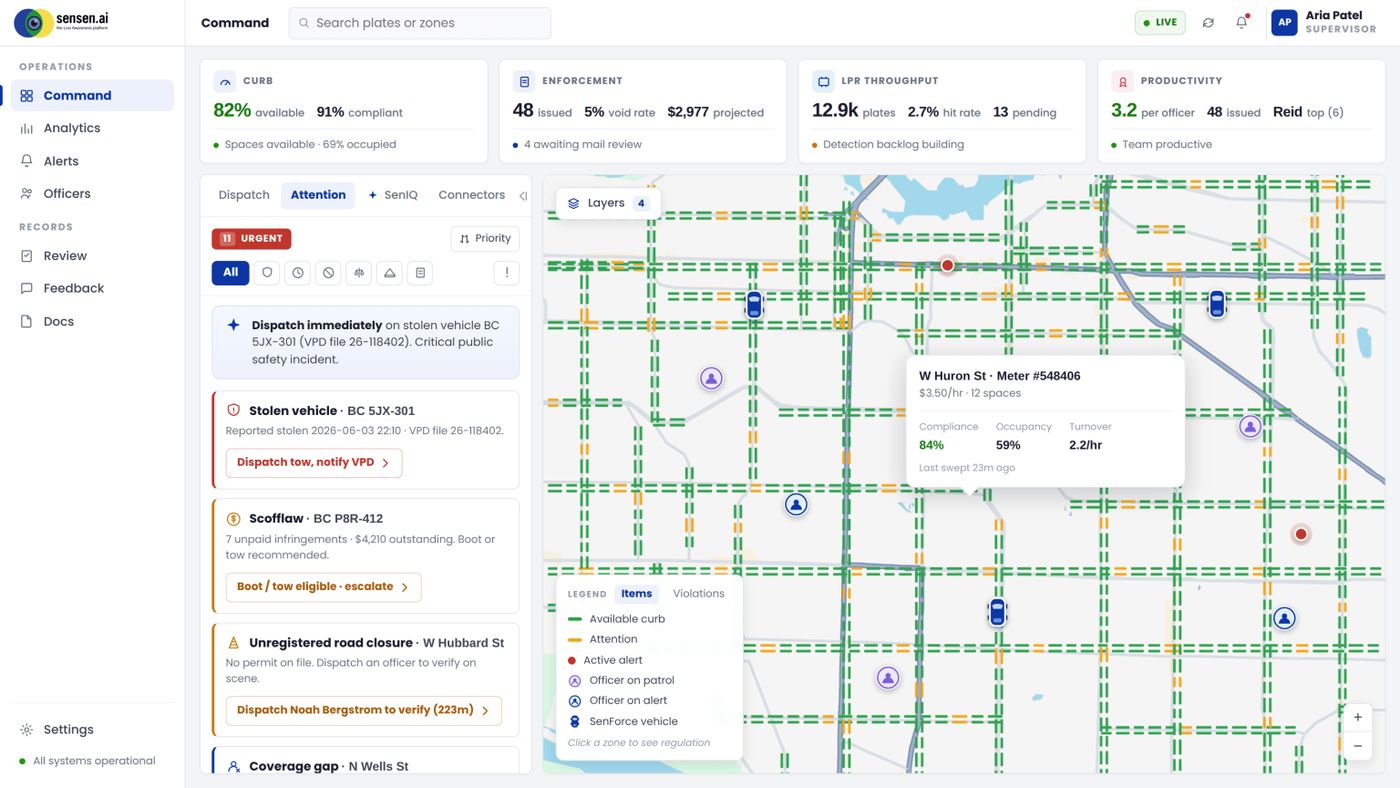
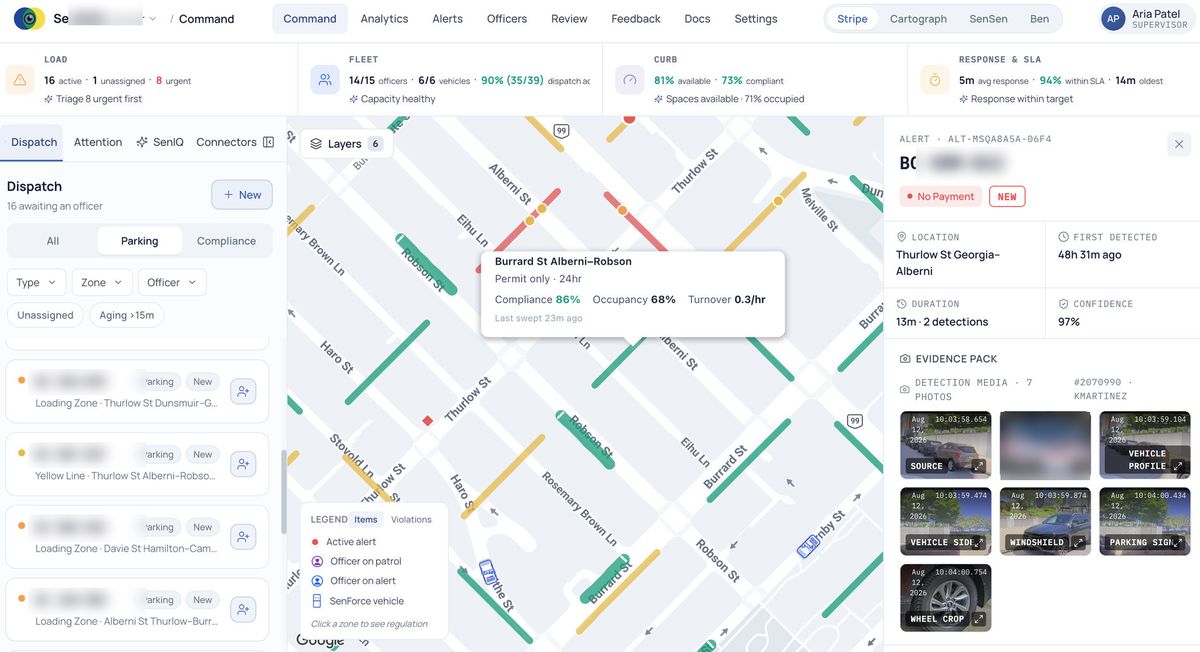
The data to understand the curb is already in your operation, captured on the passes you run daily. SenOPS puts it to work.

Block by block, hour by hour, your officers measure turnover, dwell and demand every time they pass. Most systems keep the violations and throw the rest away.
SenOPS keeps all of it, and turns it into one live view of the curb you can act on today, from the operation you already run.

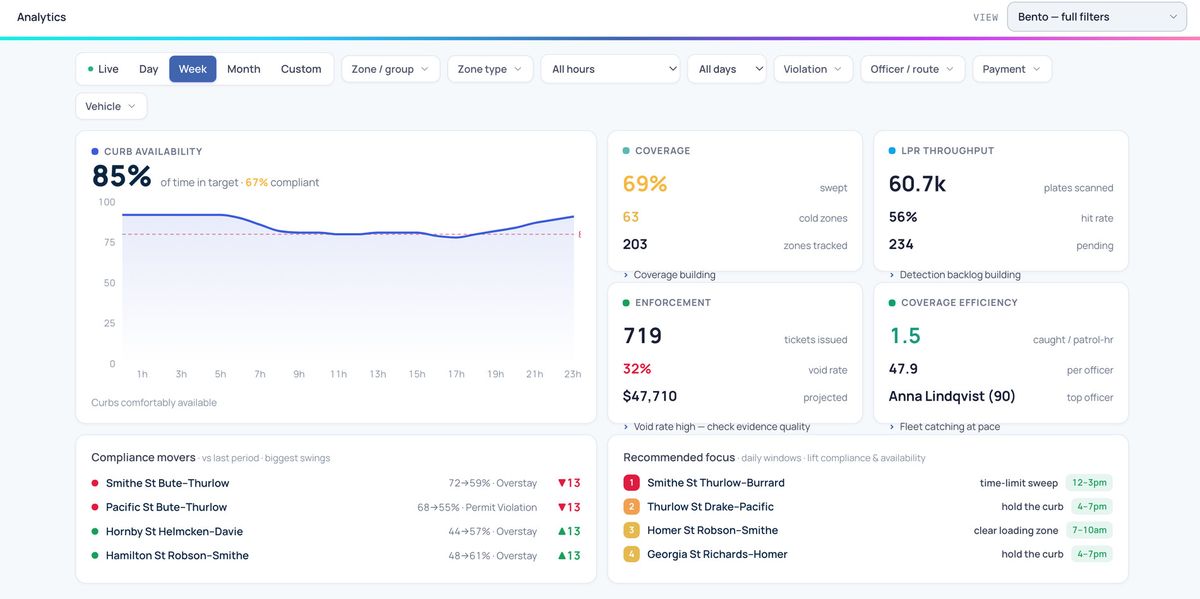
Every pass samples occupancy, turnover, dwell and demand while it checks compliance. SenOPS turns that into rate validation, policy modeling and a citywide compliance scoreboard you can stand behind.
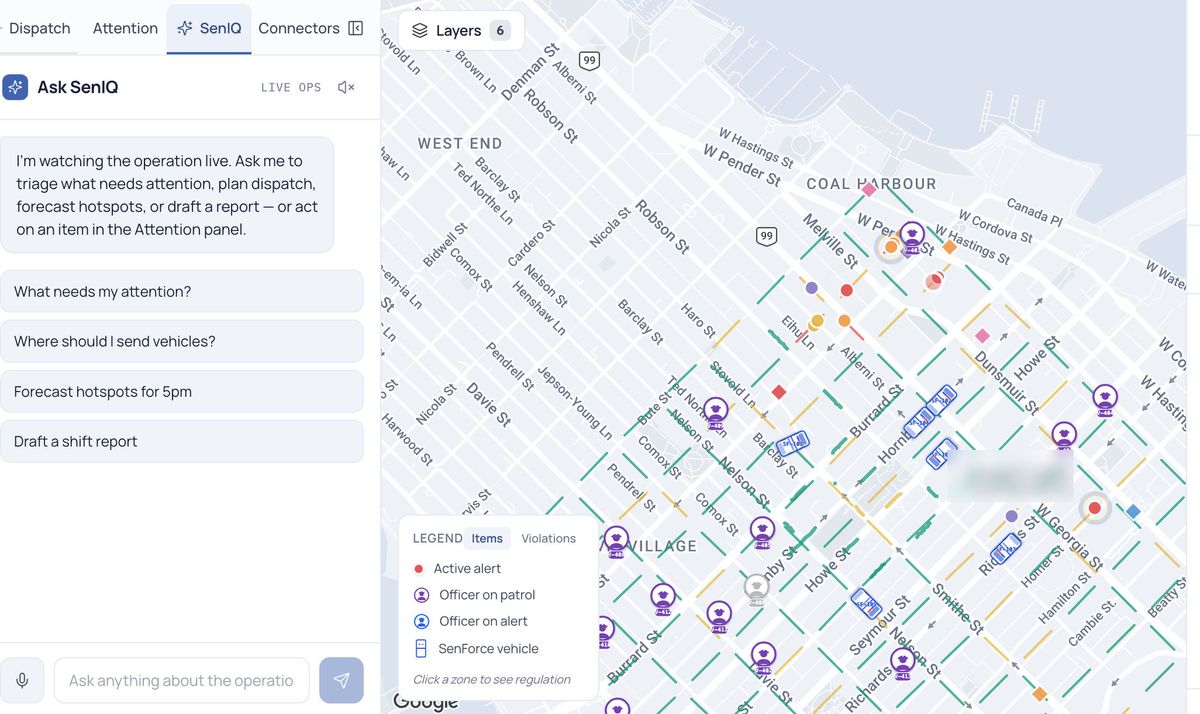
Ask what needs your attention, which blocks ran hot at lunch, or whether the rate change moved behavior. Plain-English answers from your own operation, without waiting on a reporting cycle.
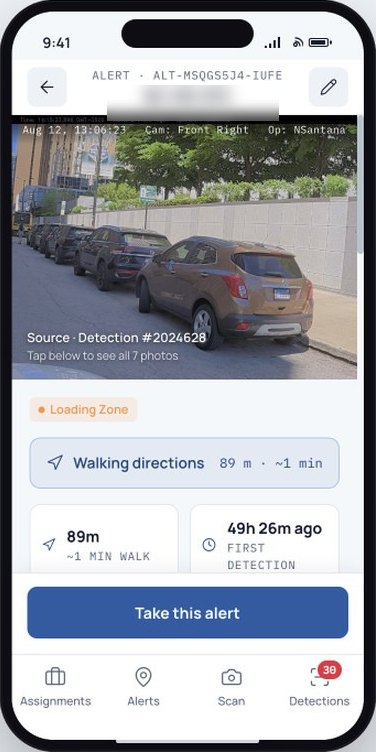
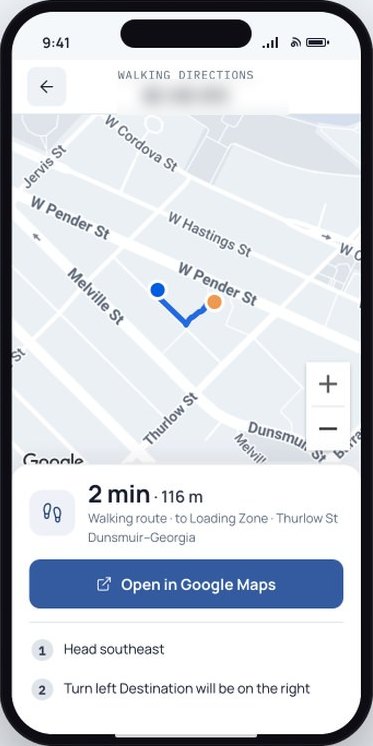
The map shows who is closest and what matters most, and predicted overstays put officers on the right block at the right time.


The curb is already telling you things nobody is hearing. Connection is the feature in the SenSen platform that links our own data collection to our partner Turnstone’s deep analytics and predictive modelling, and to any other input that matters: weather, traffic, construction.
One continuous, self-correcting feedback loop. Every pass sharpens the picture, and the loop corrects itself.
Every pass records occupancy, turnover, overstay and compliance, from the fleet you already run.
SenSen links its live curb data to the intelligence that explains it, led by our partner Turnstone.
Collection to direction. Hidden data, put to work.
Bring your zone map and your current systems. We will walk SenOPS against your operation, in about thirty minutes.
Your vehicles pass the same blocks every day and record what is parked there. SenOPS keeps that record and builds it into a live occupancy picture, block by block. No survey crew, no six-figure invoice, no waiting.
Open the block. See how long vehicles stay, how often spaces turn over, and how many drivers go past the limit. When a business owner challenges the rule, you have ninety days of data instead of an opinion.
SenOPS holds the history. Compare occupancy, dwell and compliance before and after any change you make, then take the chart to council. Show them what the rate did to behavior.
Averages hide the block that sits at 140% every lunchtime and pushes the overflow onto the street behind it. SenOPS flags the blocks running hot and the ones nobody uses. You see it before the complaint lands.
Closures and events push parking somewhere else, usually somewhere unprepared for it. SenOPS shows you where it went, the next morning. Move officers and signage before the phones start.
SenOPS tracks compliance as a citywide number you can trend over time, alongside the citations you issue. When enforcement works, compliance rises and citations fall. Now you can show both.

Enforcement still runs on habit in most cities. Officers patrol the routes they have always patrolled, whether or not that is where the problem is today. SenOPS puts the data to work on the deployment decision.
SenOPS is the data layer on top, not a rip-and-replace. It connects to what you run today and turns the combined feeds into one operational picture.
When your buses, bikes and patrol vehicles run in sync, the curb tells you where to be next. That is intelligence no single system can see. SenSen hardware makes the picture richer, but it is not the price of entry.
Turnstone’s analytics and predictive modelling connect the same way, through Connection, with no disruption to existing operations.
What is the biggest challenge with your curb right now? Tell us, and we will come back with how other cities solved it.
SenSen Networks (ASX: SNS), a global leader in Live Awareness for smart cities, and Turnstone Data, a Parking Insights platform, today announced a strategic partnership to deliver dynamic parking intelligence to municipalities across North America.
Read the full release →5 things your curb data can tell you that a parking study can’t. The questions your patrols are already answering, and how to get the answers out.
SenOPS is SenSen’s dynamic curb and parking intelligence tool. It turns every patrol into a live picture of the curb: occupancy, turnover, dwell and demand captured alongside compliance, with analytics you can question in plain English.
SenOPS is the intelligence layer that sits on top of your operation. It reads the data your patrols already produce and turns it into curb intelligence you can act on. It does not replace your enforcement or ticketing system.
Turnstone is a partner connected through Connection, a feature of the SenSen platform. SenSen collects the curb data and turns it into direction; Connection links that data to Turnstone’s deep analytics and predictive modelling, alongside other signals such as weather, traffic and construction. Turnstone sharpens the picture, SenSen runs the loop.
No. Your patrols are the sensing layer. Every pass your vehicles and officers make measures occupancy, turnover and demand while they check compliance.
No. SenOPS builds a curb map from detection data sent by your existing LPR system, on a schedule we agree with you. That gives you occupancy, turnover, dwell and demand over time. Real-time features, including live dispatch and predicted overstays, require SenSen capture hardware.
No. SenOPS sits on top of what you run today. It connects to your existing enforcement, permit, payment, dispatch and camera systems and turns their combined data into one operational picture.
No. SenOPS finds the violation, ranks it, and puts the evidence in front of an officer. The officer decides whether it is a ticket. From there it is issued on the spot, or sent to the office for ticket by mail.